No. 1825, Luodong Road, Baoshan Industrial Zone , Shanghai, P.R. China
 +7 968 585 3443 / +86 15802111868/021-66861126
 lijingxin@hilonggroup.com

English
No. 1825, Luodong Road, Baoshan Industrial Zone , Shanghai, P.R. China+7 968 585 3443 / +86 15802111868/021-66861126lijingxin@hilonggroup.com

 No. 1825, Luodong Road, Baoshan Industrial Zone , Shanghai, P.R. China+7 968 585 3443 / +86 15802111868/021-66861126lijingxin@hilonggroup.com
 Advantage
The pipeline MFL data processing and analysis system developed by SHENGLONG is a set of world-leading professional software with batch processing capability and intelligence. It is used for oil and gas pipeline defect inspection, data processing and analysis. It is an important tool for analyzing and processing inspection data. The software can predict and avoid oil and gas leakage events caused by internal and external corrosion of oil and gas pipelines in the operation of oil and gas pipelines, accurately locate the defect points and accurately calculate the depth. It is an evaluation system for predicting potential risks and dangers.
The software has advanced automatic identification and quantitative analysis technology, which can realize automatic search, intelligent identification, accurate calculation, quantitative analysis of pipeline corrosion location and range, and provide customers with accurate inspection and analysis results. It has the characteristics of high automation, safety and reliability, convenient expansion, stable performance, excellent function and easy maintenance.
 Function
• Project management function
It mainly records some parameters and database address of the project;

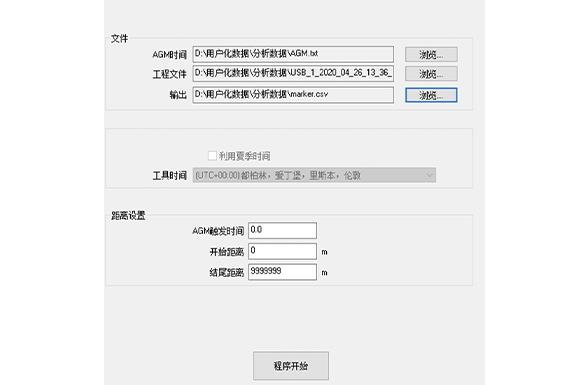
• AGMs management
During the running of ILI tools, some a will be placed AGMst intervals along the line, which will record the time of the ILI tools, and then the collected time will be imported into the data through this module, which is equivalent to setting the whole pipeline in sections, which is helpful for subsequent excavation and regular maintenance and positioning of the pipeline;
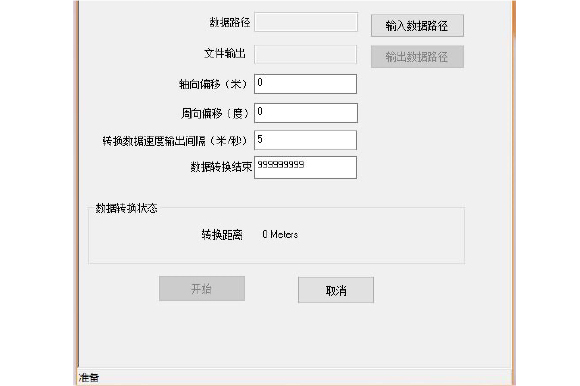
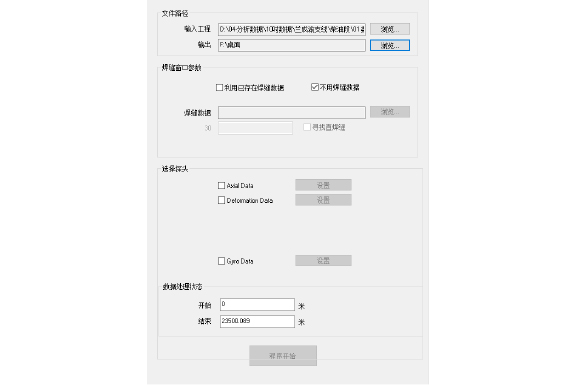
•Format conversion function
The data collected by the ILI tools is converted into a computer-readable format
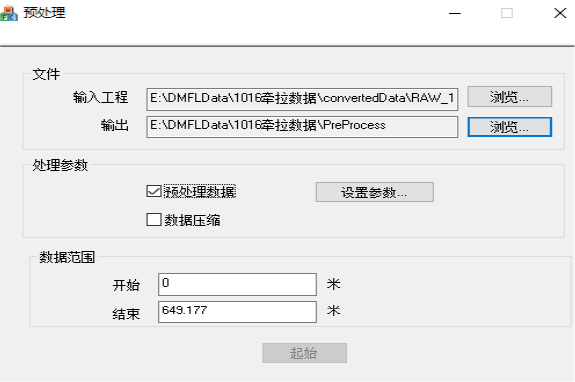
• Data filtering
Because the ILI tools will inevitably produce some noise, such as debris in the pipeline, local unevenness in the pipe manufacturing process, etc. during the running, it is necessary to conduct noise reduction on the data so that these interferences can be filtered out in the subsequent automatic identification of features
• Find
An automatic search for the database, generating the database according to the set parameters, and searching for some features at the same time
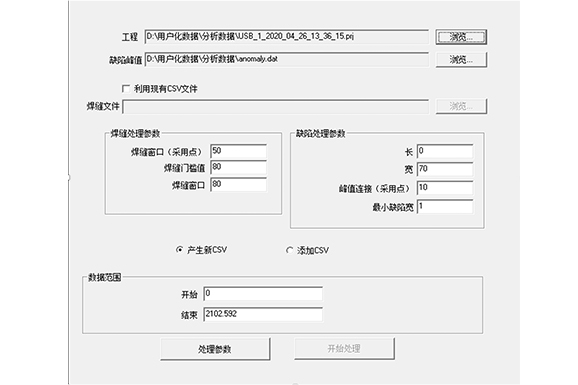
• Defect finding
Realize the function of automatic defect analysis by software, and start automatic analysis by importing data and setting parameters
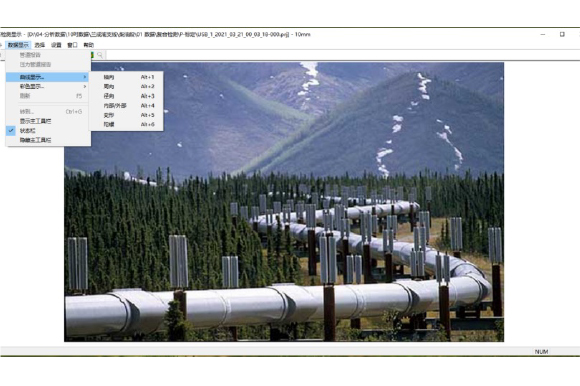
• Chart display
You can open each axis of the data, such as the triaxial, deformation, IDOD, gyroscope curve and color map of the software.
 Introduction of customized software
The customized analysis software is mainly used to display the inspection results, which is equivalent to an electronic report. The customized software runs in the windows environment, with strong adaptability and easy operation. It has a variety of chart statistics and display functions, and can view the characteristics of the test data at will, and form statistical charts, dig sheets, etc.
• Function
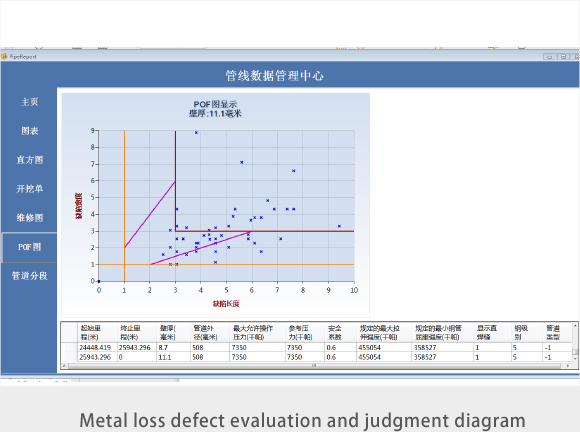
The customized software can query the Triaxial waveform and contour, and has a variety of chart display functions.
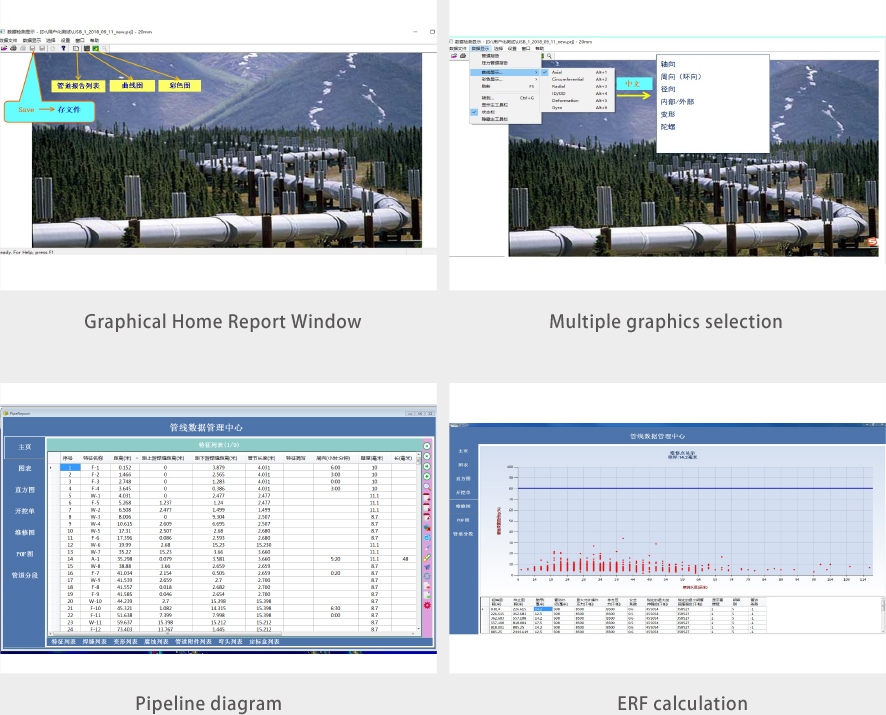
Evaluate the residual strength of defects, predict the residual life of defective pipelines, evaluate the acceptability of deformation, and sort maintenance

 +7 968 585 3443 / +86 15802111868
 lijingxin@hilonggroup.com
 No. 1825, Luodong Road, Baoshan Industrial Zone , Shanghai, P.R. China